
Dashboard & AnalyticsAnalytics: Understand Your Traffic & Agent
Analytics: Understand Your Traffic & Agent
Understand your agent’s performance: conversations, messages, leads, conversion, and traffic sources.
The Analytics section turns your agent’s activity into numbers you can act on: how many conversations happen, how engaged visitors are, how many leads are captured, and where your traffic comes from.
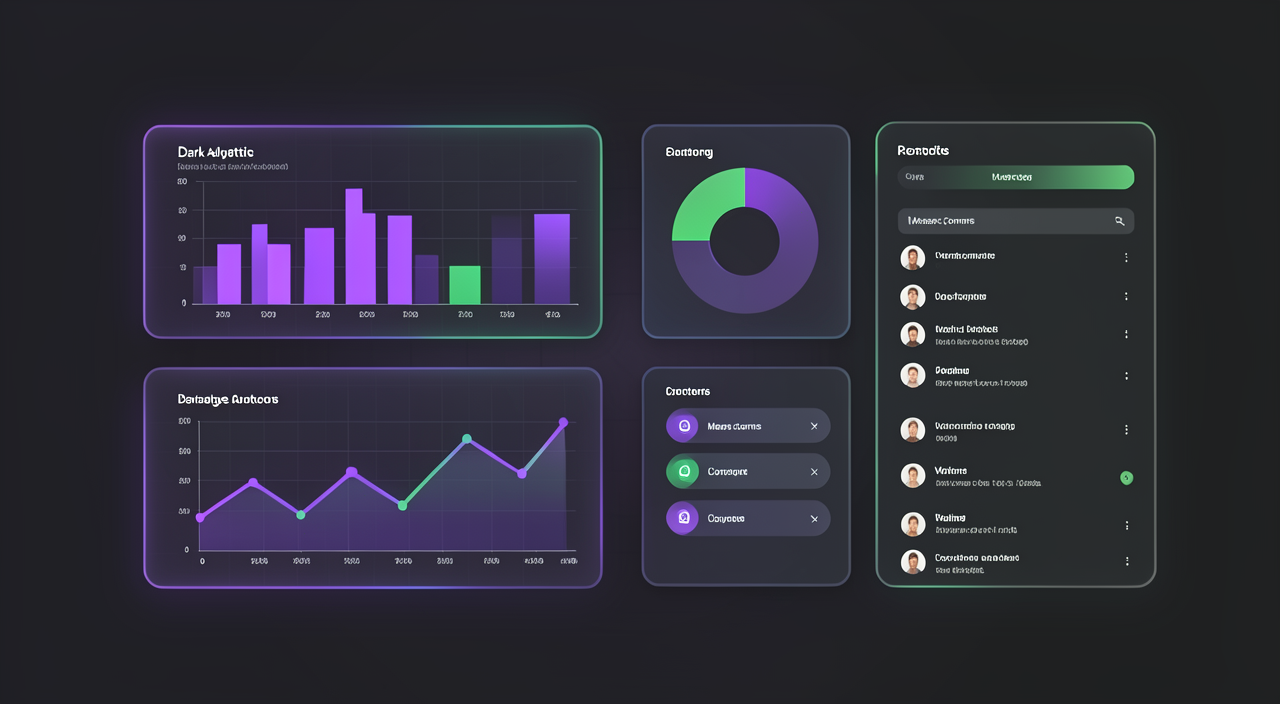
What You’ll See
- Conversations — how many chat sessions your agent handled in the selected period, with a trend vs. the previous period.
- Messages — total user messages and AI replies (both count toward your monthly limit), plus the average message count per conversation.
- Active & response rate — how many conversations went past two customer replies, and what share of messages came from your AI agent.
- Leads & conversion — how many qualified leads were captured and what share of conversations converted.
- Conversations by source — where conversations come from (Playground vs. Website Widget), so you can see which channels drive traffic.
How to Use It
- 1Spot campaign impact — after launching a promotion, watch the conversations trend and lead count grow.
- 2Review channel performance — compare Playground vs. Website Widget to see where your visitors actually chat.
- 3Monitor agent load — if you’re approaching your message limit, analytics helps you plan an upgrade before it happens.
Pair with Chat LogsNumbers tell you what happened; Chat Logs tell you why. When you see an anomaly in analytics, open the relevant conversations to understand it.